> ## Documentation Index
> Fetch the complete documentation index at: https://bruno-a6972042-mintlify-4e261c89.mintlify.site/llms.txt
> Use this file to discover all available pages before exploring further.
# Dev Tools
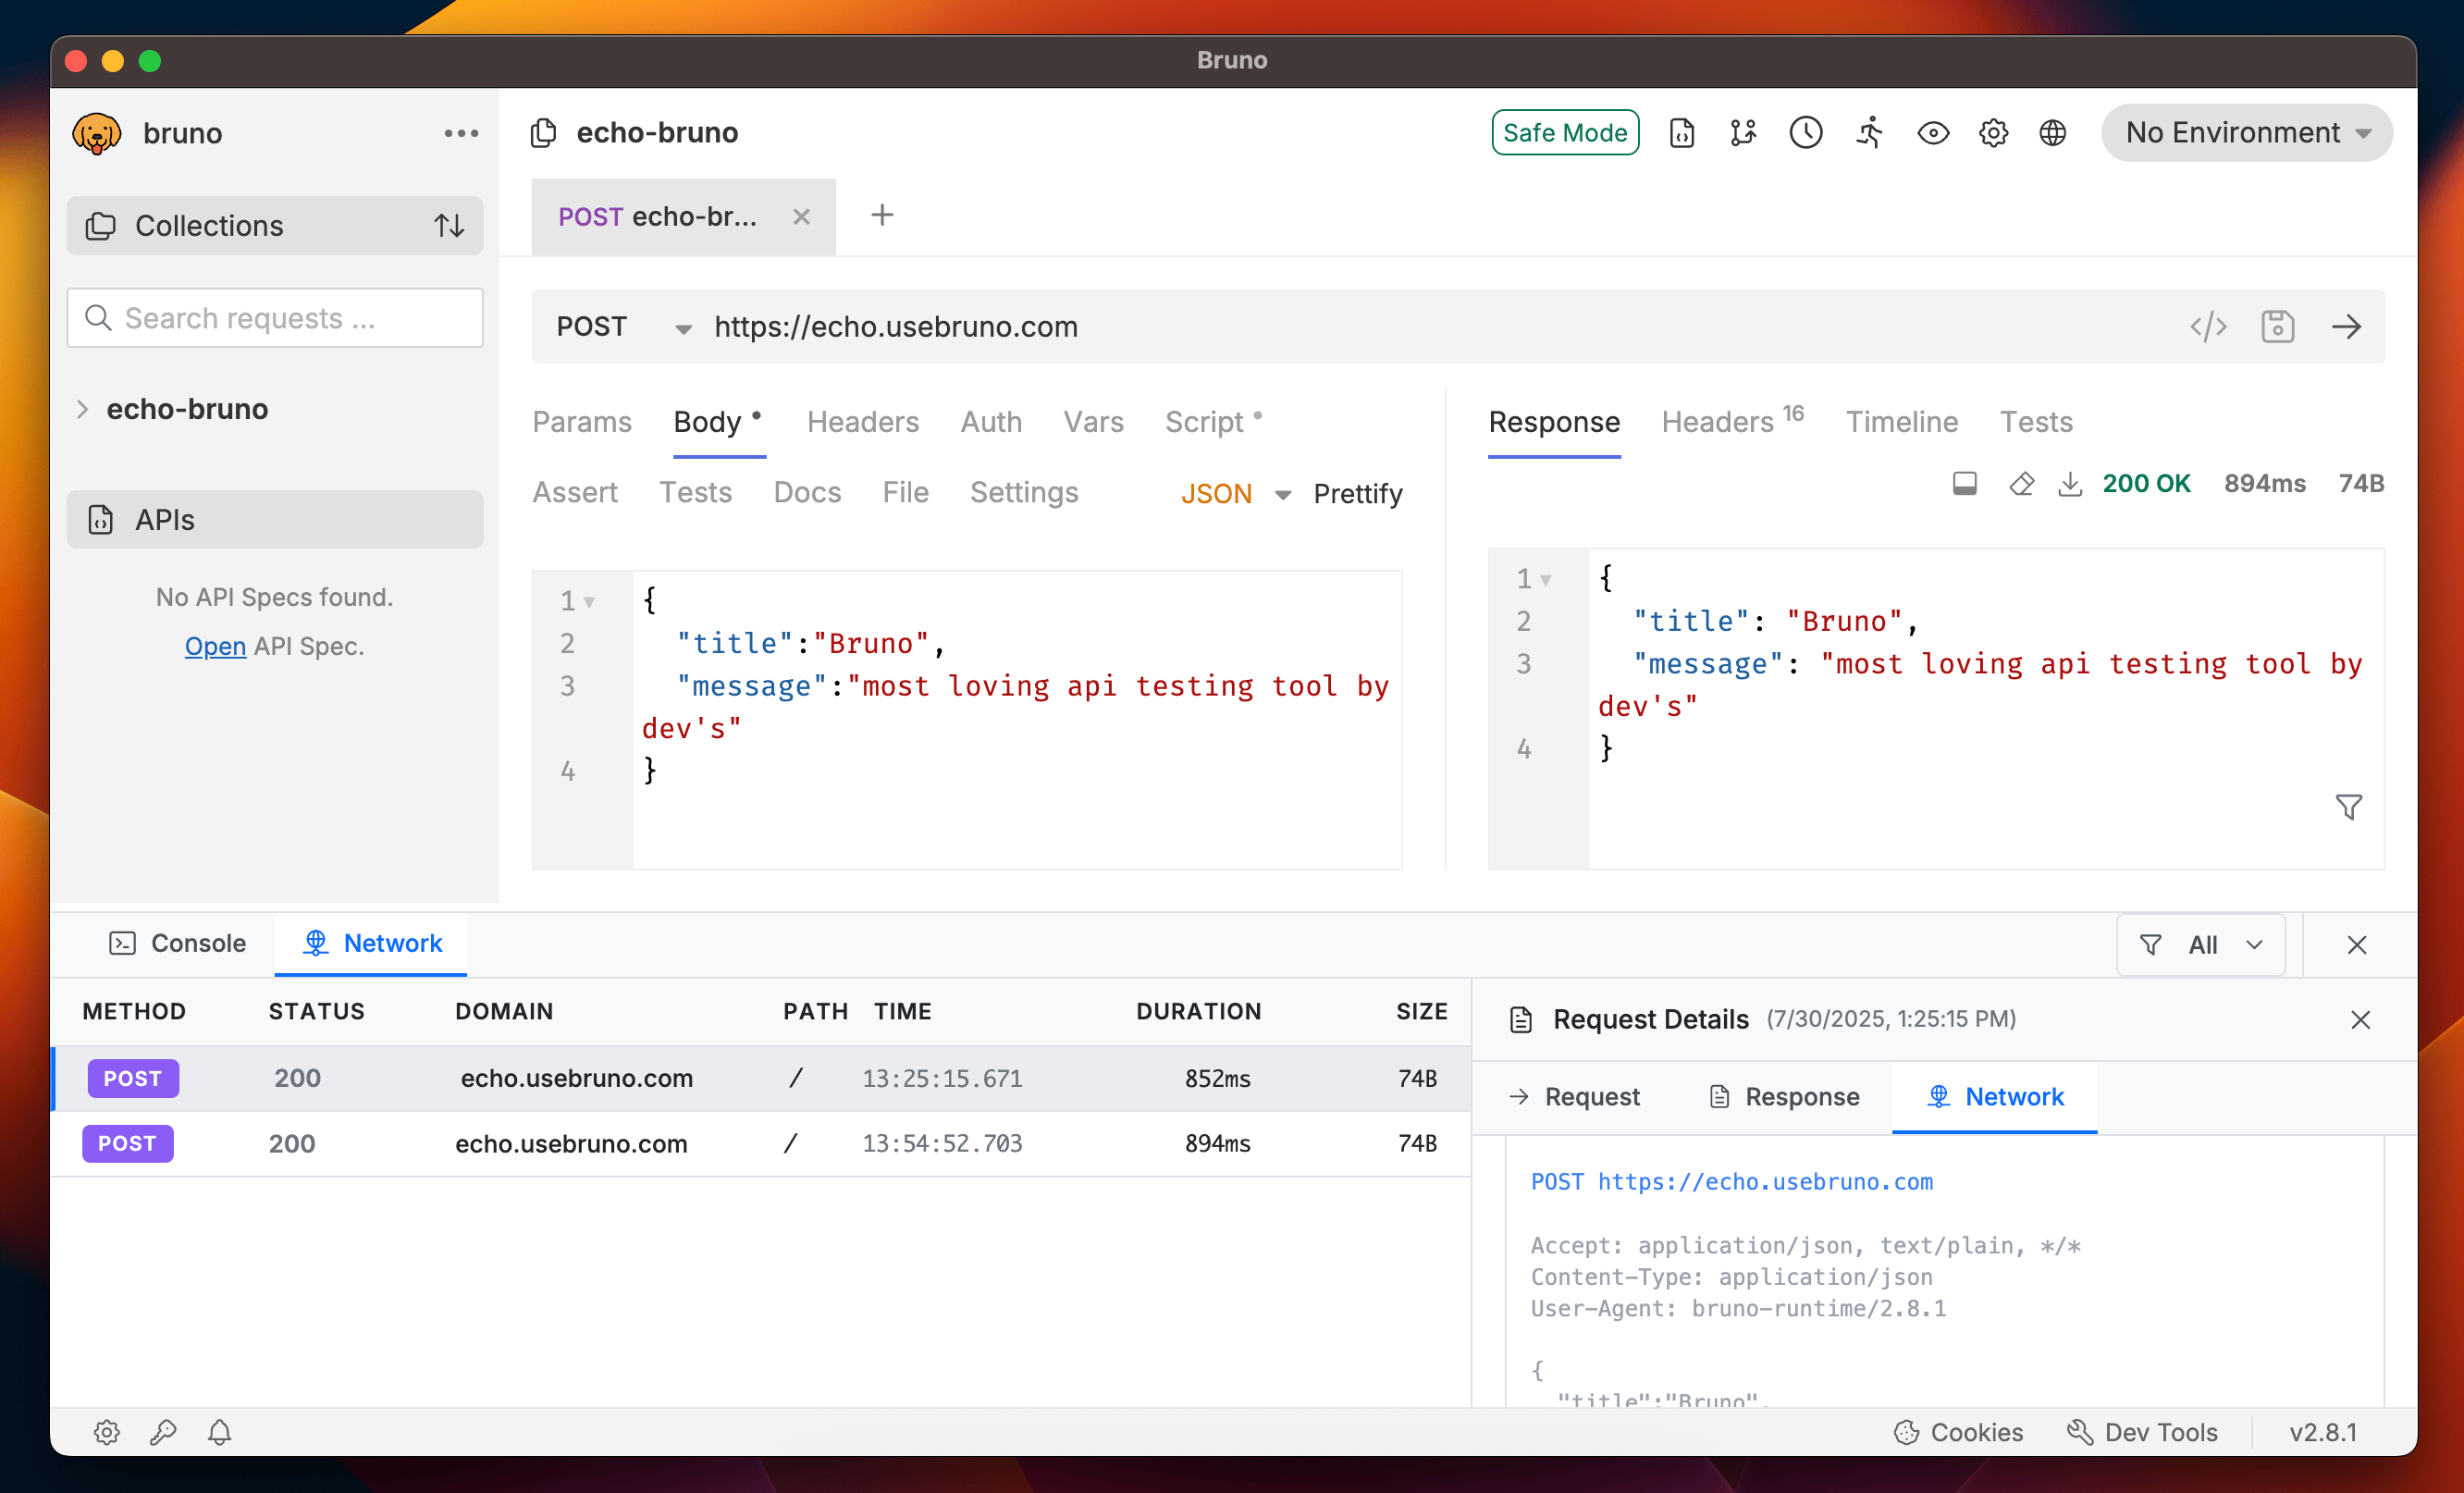
Bruno provides built-in Dev Tools to help you debug your APIs, catch bugs, test functionality, and get all essential details related to your API requests. The Dev Tools feature two main tabs:
1. **Console** - For testing, scripting, and debugging
2. **Network** - For analyzing network configurations and performance
The Dev Tools are available in [Bruno 2.8.0](https://www.usebruno.com/downloads) or higher versions.
## Accessing Dev Tools
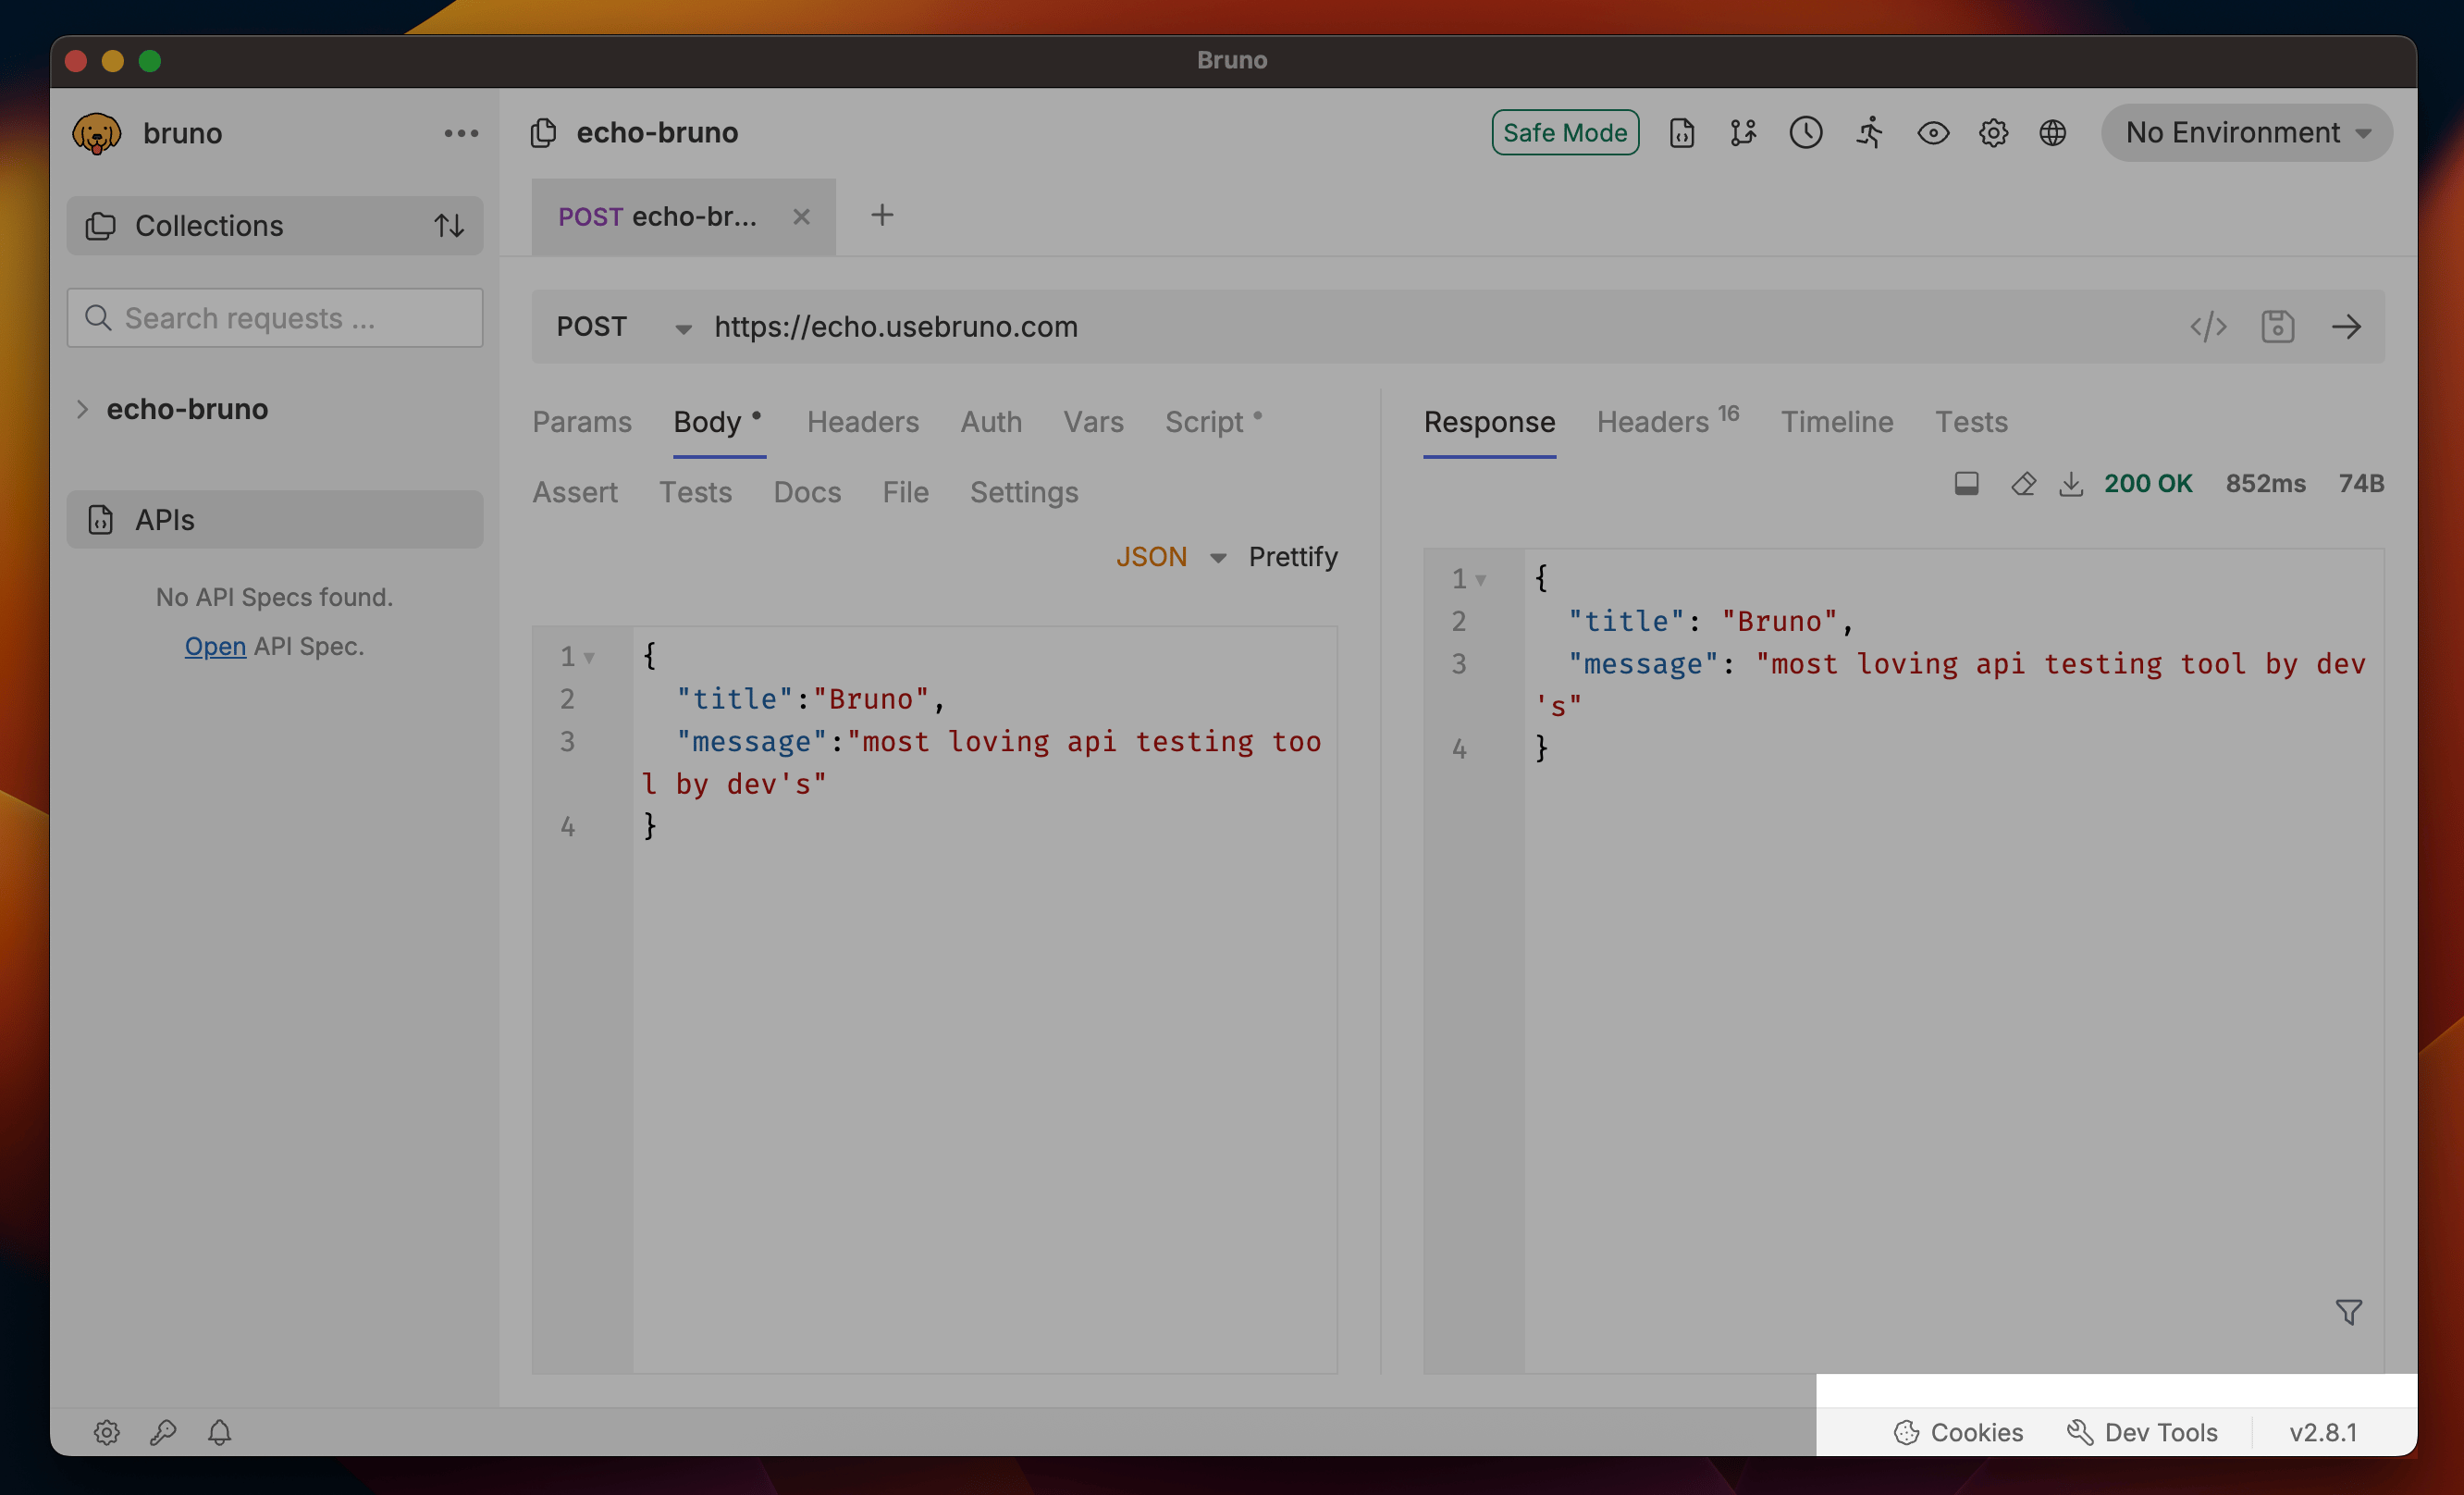
The Dev Tools are located in the bottom-right corner of the interface, next to the cookies button. Simply click on the Dev Tools icon to open and start using the debugging features.
 ## Console
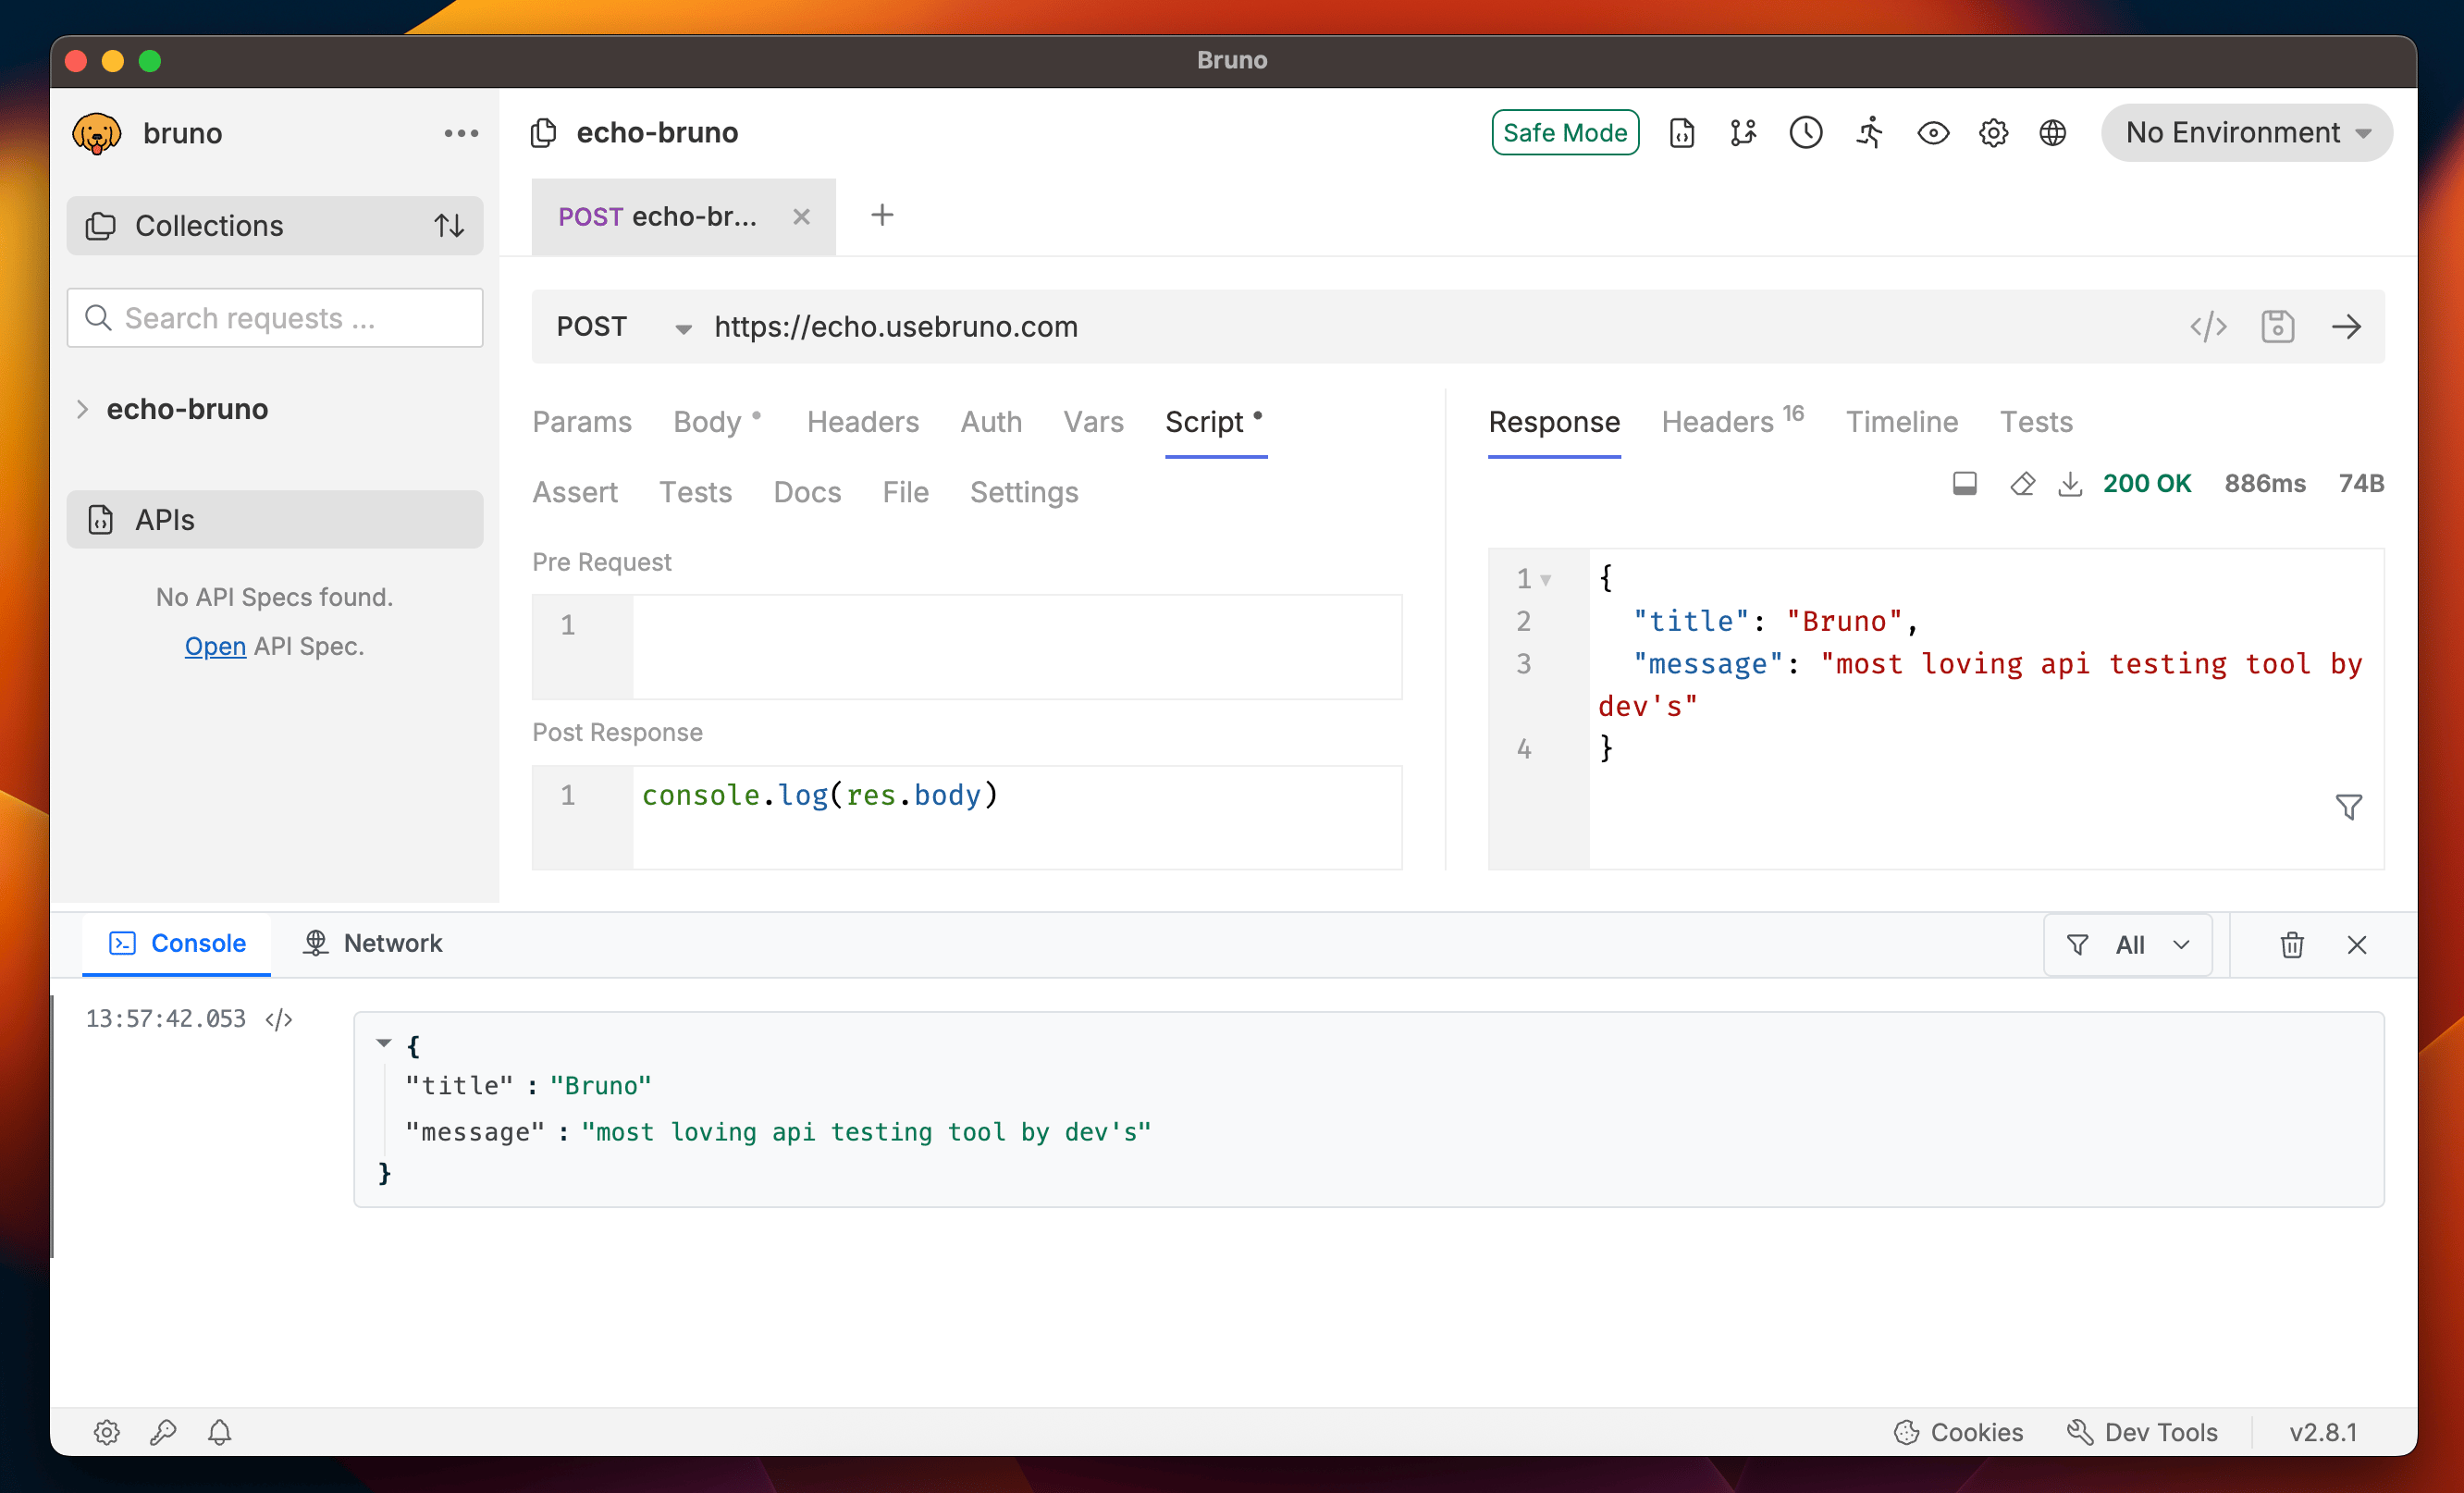
The Console tab is your primary debugging companion in Bruno. It provides a powerful environment for:
* **Testing and Scripting**: Execute JavaScript code and test your API logic
* **Debugging**: Troubleshoot API issues and scripting problems
* **Logging**: View console outputs, errors, and debugging information
* **Interactive Development**: Similar to browser developer tools but customized for Bruno
## Console
The Console tab is your primary debugging companion in Bruno. It provides a powerful environment for:
* **Testing and Scripting**: Execute JavaScript code and test your API logic
* **Debugging**: Troubleshoot API issues and scripting problems
* **Logging**: View console outputs, errors, and debugging information
* **Interactive Development**: Similar to browser developer tools but customized for Bruno
 ## Network
The Network tab provides comprehensive insights into your API requests and responses. It's essential for:
* **Security Validation**: Review security headers and authentication details
* **Request/Response Inspection**: Examine headers, body, and status codes
* **Network Configuration**: Verify proxy settings and connection details
* **Troubleshooting**: Identify network-related issues and errors
This tab gives you complete visibility into the network layer of your API interactions, helping you validate response data and understand the full request lifecycle.
## Network
The Network tab provides comprehensive insights into your API requests and responses. It's essential for:
* **Security Validation**: Review security headers and authentication details
* **Request/Response Inspection**: Examine headers, body, and status codes
* **Network Configuration**: Verify proxy settings and connection details
* **Troubleshooting**: Identify network-related issues and errors
This tab gives you complete visibility into the network layer of your API interactions, helping you validate response data and understand the full request lifecycle.